Graphing Polar Equations
The most basic method of graphing polar equations is by plotting points and doing a quick sketch. Graphing polar equations is a skill that requires the ability to plot points and sometimes recognize a special case of polar curves, such as cardioids, and roses and conic sections. However, we need to understand the polar coordinate system and how to plot points for graphing polar equations. The graph of a polar equation r = f(θ), or more generally F(r, θ) = 0, consists of all points P that have at least one polar representation (r, θ) whose coordinates satisfy the equation. EXAMPLE: Sketch the polar curve θ = 1. Solution: This curve consists of all points (r, θ) such that the polar angle θ is 1 radian. It is the straight line that passes through O and makes an angle of 1 radian with the polar axis. Notice that the points (r, 1) on the line with r > 0 are in the first quadrant, whereas those with r < 0 are in the third quadrant.
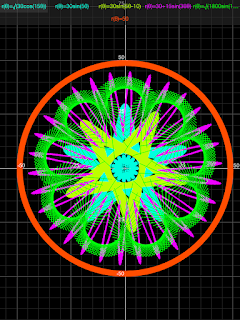
And these are the polar equations that I had created.
And these are the polar equations that I had created.


No comments:
Post a Comment