Friday, February 27, 2015

Cramer's Rule
Given a system of linear equations, Cramer's Rule is a handy way to solve for just one of the variables without having to solve the whole system of equations. They don't usually teach Cramer's Rule this way, but this is supposed to be the point of the Rule: instead of solving the entire system of equations, you can use Cramer's to solve for just one single variable. 
Let's use the following system of equations: 
2x + y + z = 3 
x – y – z = 0 
x + 2y + z = 0
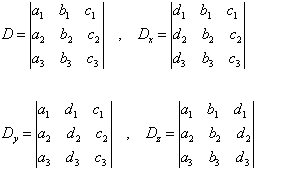
We have the left-hand side of the system with the variables (the "coefficient matrix") and the right-hand side with the answer values. Let D be the determinant of the coefficient matrix of the above system, and let Dx be the determinant formed by replacing the x-column values with the answer-column values:

    D_x = 3
    D_y = -6


Friday, February 20, 2015

Systems of Equations 
A system of equations is a set or collection of equations that you deal with all together at once. Linear equations (ones that graph as straight lines) are simpler than non-linear equations, and the simplest linear system is one with two equations and two variables. Think back to linear equations. For instance, consider the linear equation y = 3x – 5. A "solution" to this equation was any x, y-point that "worked" in the equation. 
So (2, 1) was a solution because, plugging in 2 for x: 
3x – 5 = 3(2) – 5 = 6 – 5 = 1 = y 
On the other hand, (1, 2) was not a solution, because, plugging in 1 for x: 
 3x – 5 = 3(1) – 5 = 3 – 5 = –2
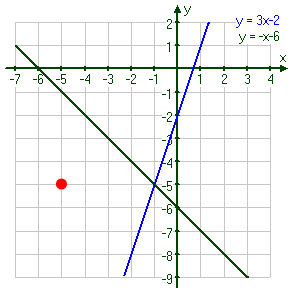
Since the two equations above are in a system, we deal with them together at the same time. In particular, we can graph them together on the same axis system.
A solution for a single equation is any point that lies on the line for that equation. A solution for a system of equations is any point that lies on each line in the system. For example, the red point at right is not a solution to the system, because it is not on either line.

Monday, February 9, 2015

Graphing Polar Equations
The most basic method of graphing polar equations is by plotting points and doing a quick sketch. Graphing polar equations is a skill that requires the ability to plot points and sometimes recognize a special case of polar curves, such as cardioids, and roses and conic sections. However, we need to understand the polar coordinate system and how to plot points for graphing polar equations. The graph of a polar equation r = f(θ), or more generally F(r, θ) = 0, consists of all points P that have at least one polar representation (r, θ) whose coordinates satisfy the equation. EXAMPLE: Sketch the polar curve θ = 1. Solution: This curve consists of all points (r, θ) such that the polar angle θ is 1 radian. It is the straight line that passes through O and makes an angle of 1 radian with the polar axis. Notice that the points (r, 1) on the line with r > 0 are in the first quadrant, whereas those with r < 0 are in the third quadrant.
And these are the polar equations that I had created.


Friday, February 6, 2015

Polar Coordinates
The polar coordinates r (the radial coordinate) and theta (the angular coordinate, often called the polar angle) are defined in terms of Cartesian coordinates by:
 x = rcostheta (1) y = rsintheta
where r is the radial distance from the origin, and theta is the counterclockwise angle from the x-axis. In terms of √(x^2+y^2) (3) theta = tan^(-1)(y/x). (4) (Here, tan^(-1)(y/x) should be interpreted as the two-argument inverse tangent which takes the signs of x and y into account to determine in which quadrant theta lies.) It follows immediately that polar coordinates aren't inherently unique; in particular, (r,theta+2npi) will be precisely the same polar point as (r,theta) for any integer n. What's more, one often allows negative values of r under the assumption that (-r,theta) is plotted identically to (r,theta+/-pi).
We start with a cartesian coordinate system. We choose O as pole and the x-axis as polar-axis. The cartesian coordinates of a point P are (x,y). Choose the u-axis such that r > 0. then P = r U => P2 = r2 U2 => x2 + y2 = r2 r = sqrt(x2 + y2) Now, choose a t-value such that x = r.cos t and y = r.sin t

Friday, January 30, 2015

Conic Section
Conic sections are the curves which can be derived from taking slices of a "double-napped" cone. (A double-napped cone, in regular English, is two cones "nose to nose", with the one cone balanced perfectly on the other.)
If you think of the double-napped cones as being hollow, the curves we refer to as conic sections are what results when you section the cones at various angles.
There are some basic terms that you should know for this topic: 
Center: the point (h, k) at the center of a circle, an ellipse, or an hyperbola. 
Vertex: in the case of a parabola, the point (h, k) at the "end" of a parabola; in the case of an ellipse, an end of the major axis; in the case of an hyperbola, the turning point of a branch of an hyperbola. 
Focus: a point from which distances are measured in forming a conic; a point at which these distance-lines converge, or "focus". 
Directrix: a line from which distances are measured in forming a conic. 
Axis: a line perpendicular to the directrix passing through the vertex of a parabola. 
Major axis: a line segment perpendicular to the directrix of an ellipse and passing through the foci; the line segment terminates on the ellipse at either end; also called the "principal axis of symmetry"; the half of the major axis between the center and the vertex is the semi-major axis. 
Minor axis: a line segment perpendicular to and bisecting the major axis of an ellipse; the segment terminates on the ellipse at either end; the half of the minor axis between the center and the ellipse is the semi-minor axis. 
Each conic has a "typical" equation form, sometimes along the lines of the following:
    parabola: Ax2 + Dx + Ey = 0
    circle: 
    x2 + y2 + Dx + Ey + F = 0
    ellipse: 
    Ax2 + Cy2 + Dx + Ey + F = 0
    hyperbola: 
    Ax2 – Cy2 + Dx + Ey + F = 0

Friday, January 23, 2015

Parabola
To form a parabola, you would start with a line and a point off to one side. The line is called the "directrix"; the point is called the "focus". The parabola is the curve formed from all the points (x, y) that are equidistant from the directrix and the focus. The line perpendicular to the directrix and passing through the focus (that is, the line that splits the parabola up the middle) is called the "axis of symmetry". The point on this axis which is exactly midway between the focus and the directrix is the "vertex"; the vertex is the point where the parabola changes direction.

The "vertex" form of a parabola with its vertex at (h, k) is: regular: y = a(x – h)2 + k sideways: x = a(y – k)2 + h
The conics form of the parabola equation (the one you'll find in advanced or older texts) is: regular: 4p(y – k) = (x – h)2 sideways: 4p(x – h) = (y – k)2
The relationship between the "vertex" form of the equation and the "conics" form of the equation is nothing more than a rearrangement: y = a(x – h)2 + k y – k = a(x – h)2 (1/a)(y – k) = (x – h)2 4p(y – k) = (x – h)2

Tuesday, January 6, 2015

                                                                  1st semester 
3 things done well
I didn't do very well first semester. I did well on memorizing the trigonometric identities. I did well on knowing how to solve majority of the trigonometric identities. But for the majority of math, essentially chapters 2-4, I did not do well on. 
3 Goals to improve on
Whenever I need help, I would to come to Ms. V before a test and especially as soon as possible. I need to study more, if I did not get a chance to ask for help. Also I need to resolve my internet issue quicker. 
Favorite Christmas break story
My dad and his friend kept arguing whether to celebrate and eat on Christmas Eve or on Christmas Day.